







Strategic Sustainability Leader · San Diego, CA

James Bell-Torres

Energy and sustainability subject matter expert focused on finding practical energy and water waste in commercial, campus, and lab buildings.

About

James Bell-Torres likes reducing energy and water waste while making building systems easier to understand. His work centers on finding misbehaving building systems, quantifying the waste, and turning those findings into practical projects.

His experience includes utility incentive program research and design, demand response and customer-side load management program development, and commercial energy saving products and services.

For client campuses, his work has included corporate zero emissions roadmap creation, integrated facility management stakeholder engagement, existing building commissioning strategy, and energy hurdles across cafes, R&D labs, chemistry labs, GMP facilities, and offices.

HVAC/BAS ASHRAE Audits Lab Buildings CxPlots JLL

Annual Savings To-Date

Energy-efficient light bulb 64.6 gWh
Building equipment representing natural gas savings 1,500,000 therms
Water flowing from a faucet 185 million gals
Currency representing building operating costs $18.9 million
Over a decade working on commercial and lab buildings, I've developed a structured approach to finding energy waste. Here's what I've learned.

Knowledge

Why buildings matter

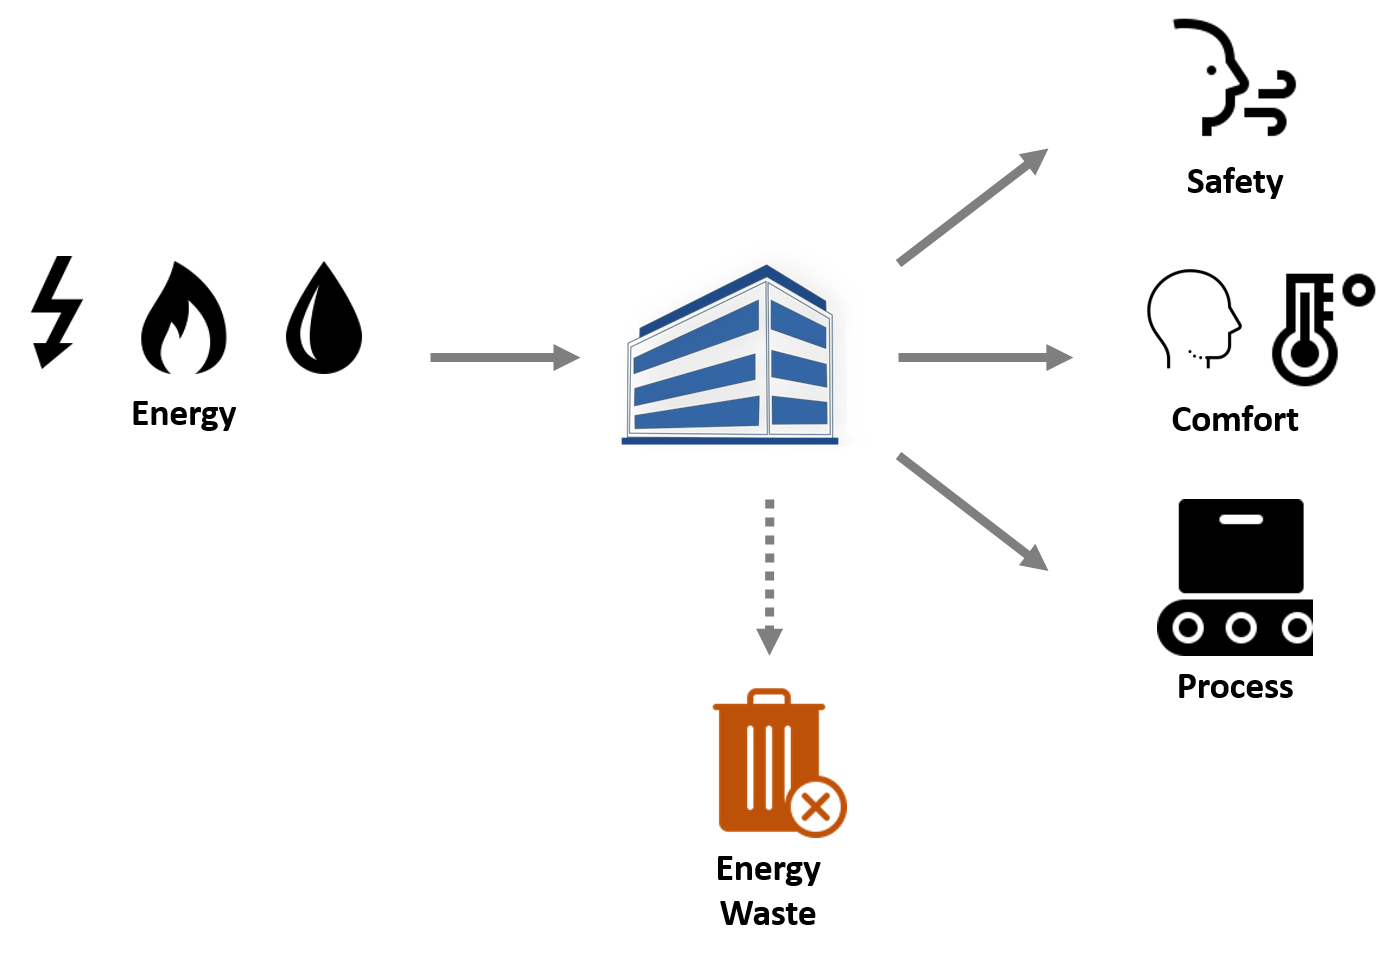
Buildings give us comfortable places to gather when it is hot or cold outside. They also provide space to conduct science, build technology, and provide entertainment. To do that, they consume electricity, natural gas, and water to keep people safe, comfortable, and productive.

The building industry is good at providing fresh air, comfort, and keeping processes going. When diligence slips, though, a lot of energy waste can hide in plain sight.

40%

U.S. energy consumed by buildings

39.4 qBTU

Annual U.S. building energy consumption

90%

Average lifetime spent inside buildings

Diagram showing resources entering a building and useful output, emissions, and waste leaving it

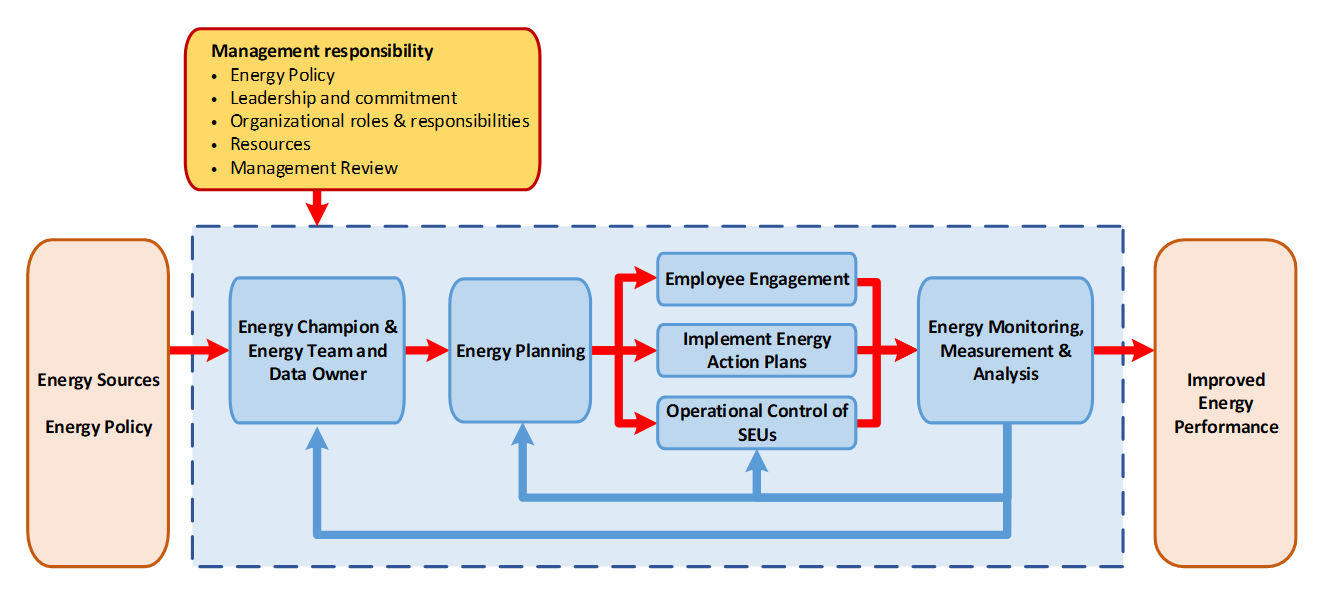
Sustainability Strategy

Guide to reducing energy and saving the world

  1. Obtain leadership (and stakeholder) buy-in and commitment
  2. Benchmark buildings
  3. Establish KPIs and set goals
  4. Create action plan
  5. Implement
  6. Evaluate progress at specified intervals
  7. Re-assess performance and adjust action plan accordingly
Strategic energy management process from energy policy through planning, action, monitoring, and improved performance

Energy Conservation Measures

A simple approach to finding opportunities: turn equipment off when it is not needed, reduce excess demand, optimize controls, and repair failed systems.

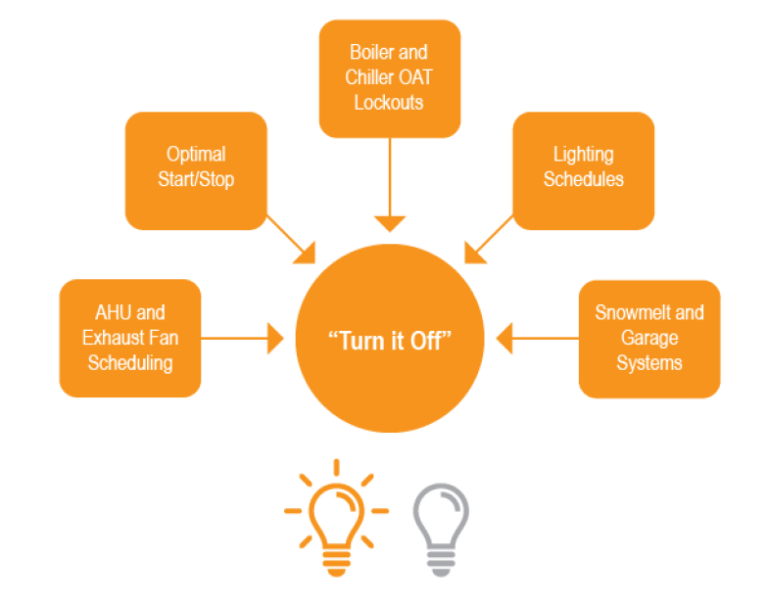
1 · Turn it off

The cheapest kWh is the one never used. Pieces of equipment have a funny way to staying on when they don't have to be. Particular items to stay on the lookout for include equipment schedules, optimal start/stop sequencing, and lockouts.

The cheapest kWh is the one never used. Pieces of equipment have a funny way to staying on when they don't have to be. Particular items to stay on the lookout for:

  • AHU, EF, and Boiler schedules
  • Optimal Start/Stop sequencing
  • Boiler and Chiller lockouts
  • Lighting schedules

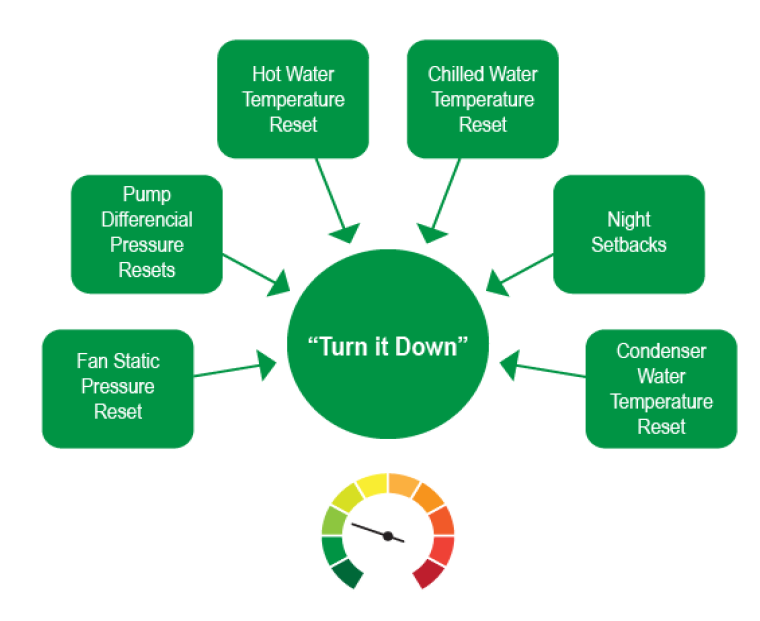
2 · Turn it down

Often times we find that we are using too much of a resource than needed. Opportunities include pressure and temperature resets, lab setbacks, and exhaust fan stack velocity reductions.

Often times we find that we are using too much of a resource than needed. In particular:

  • AHU duct static pressure and temperature resets
  • Pump differential pressure resets
  • Heating hot water temperature resets
  • Chilled water temperature resets
  • Condenser water resets
  • Night airflow and temperature setbacks: Fumehoods, Bio saftey cabnets, and unoccupied labs
  • Exhaust fan stack velocity reduction based on wind speed and direction
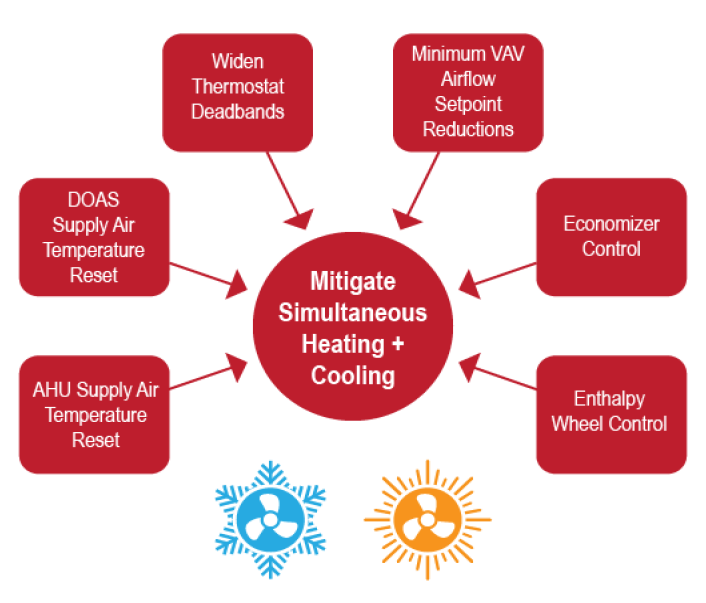
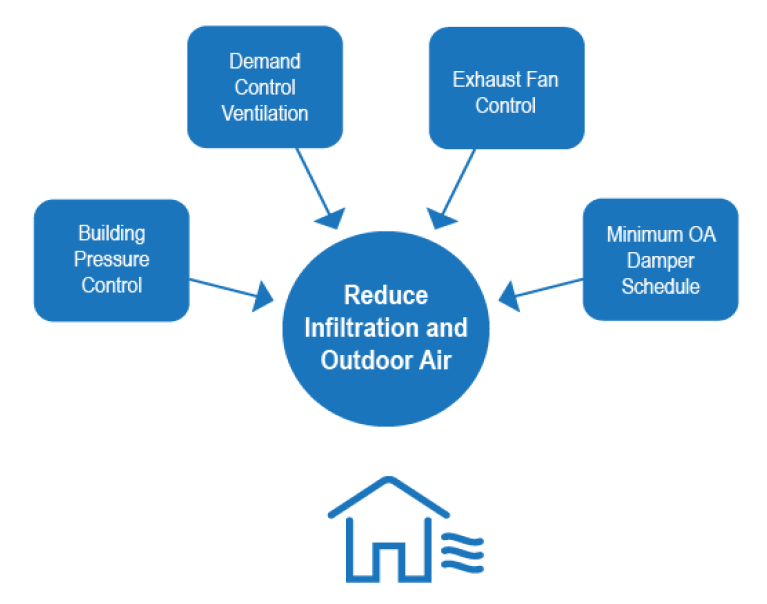
3 · Optimize it

Controls are smart in today's industry. We can leverage that with automation through trim-and-respond resets, wider deadbands, airflow reductions, economizer tuning, and demand control ventilation.

Controls are smart in today's industry. We can leverage that with automation. Many ways we can do this are:

  • Changing OAT based resets to Trim & Respond based resets where applicable
  • Tune AHU, EF, hot water, and other resets
  • Widen temperature deadbands
  • Minimum VAV airflow setpoint reductions
  • Tune economizer and minimum OA damper schedule control
  • Implement demand control ventilation
  • Building envelope sealing
4 · Repair it

Things are forgotten about or run to failure. A large opportunity, but often timely and costly, is to repair large equipment, VAV boxes, and zone-level controls.

Thing are forgotten about or ran to failure. A large opportunity, but often timely and costly is to repair it.

  • Repair large equipment e.g., AHUs, EFs, Boilers, Chillers
  • Zone level e.g., VAV boxes and controls

Quantification

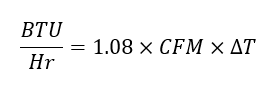
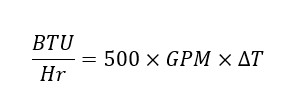
Quantification turns a good building observation into an actionable decision. Browse the original equation sequences by topic, with each carousel starting from the simplest form and moving into common unit options or system-specific variations.

Energy

Cost

Savings

Efficiency

Sensible Heat (Air)

Total Heat (Air)

Total Heat (Water)

Simple Power

Single Phase

Three Phase

Motors

Boilers

Chillers

Water

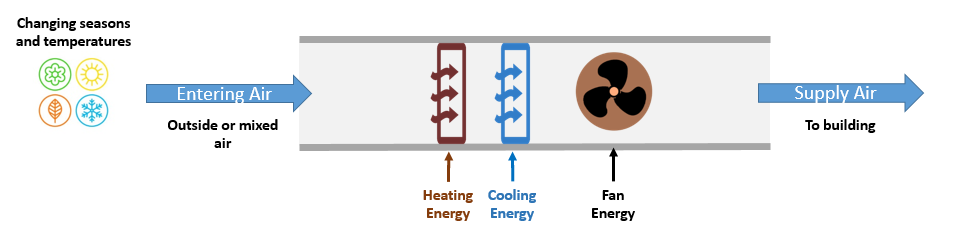
AHU

Whole Building HVAC

Tools

Quick calculators for common building energy and water savings opportunities, rebuilt from the original BuildingEnergyTools formulas with lightweight static-site controls.

Motors quick calculation

Compare pre and post fan motor energy from horsepower, speed, efficiency, rate, and operating schedule.

Motor energy equation, step 1 Motor energy equation, step 2

Shared assumptions

CO2 factor: 0.000707 metric tons/kWh

Pre condition

Runtime: 4,432 hours

Post condition

Runtime: 2,086 hours
Energy 37,336 kWh 53% reduction
Pre
Post
Cost $6,720 53% reduction
Pre
Post
CO2 27 metric tons 54% reduction
Pre
Post
Payback 7.4 years implementation cost / annual savings

Water leak waste calculation

Estimate annual water loss and cost from a continuous leak or waste flow rate.

Water leak waste equation, step 1 Water leak waste equation, step 2

Assumptions

Total rate: $18/ccf
$0.024/gal

Variables

Annual water loss 2,628,000 gal flow x 60 x 8,760
Annual water cost $63,072 annual loss x rounded $/gal

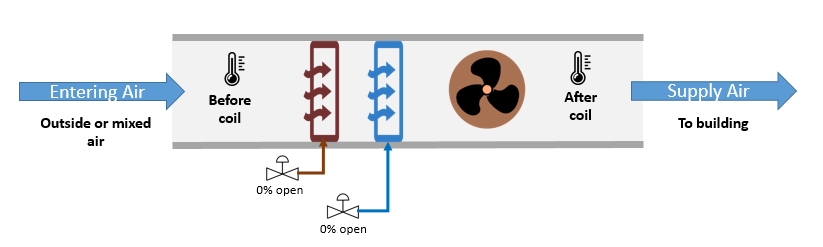
AHU coil leak-by quick calculation

Estimate energy savings from repairing a coil valve that leaks when it should be closed.

AHU heating and cooling coil leak-by diagram
AHU coil leak-by equation, step 1 AHU coil leak-by equation, step 2 AHU coil leak-by equation, step 3

Assumptions

Air flow: 48,000 CFM CO2 factor: 0.000707 metric tons/kWh

Variables

ΔT: 5.0 F Scheduled runtime: 4,432 hours Runtime valve not leaking-by: 1,752 hours Annual leak-by runtime: 2,680 hours

Energy savings 203,584 kWh repair savings estimate
Cost savings $36,645 annual electricity savings
CO2 savings 144 metric tons annual avoided emissions

Equation reference

Review the energy, heat, power, equipment, water, AHU, and HVAC equations preserved from the original site.

Open Quantification

CxPlots

Explore CxPlots for commissioning and building data visualization workflows.

Visit CxPlots

Contact

For building energy, commissioning, and controls work, use the links below.